
- Overview
- EIFU & Resources
Acumen™ Analytics Software offers you retrospective data analysis and hemodynamic insights into patient perfusion all on your personal computer.
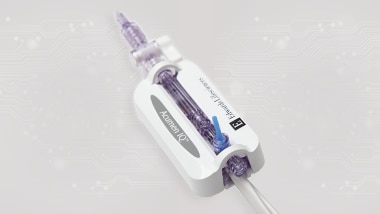
Acumen™ Analytics Software allows you to retrospectively view and analyze monitored hemodynamic parameters from HemoSphere™ Advanced Monitoring Platform when used with Acumen IQ™ Cuff, Acumen IQ™ Sensor, ClearSight™ Finger Cuff, FloTrac™ Sensor, ForeSight™ Sensor, or TruWave™ Disposable Pressure Transducer.
When using any of the blood pressure monitoring cuffs and sensors (Acumen IQ™ Cuff, Acumen IQ™ Sensor, ClearSight™ Finger Cuff, FloTrac™ Sensor, or TruWave™ Disposable Pressure Transducer), Acumen™ Analytics Software allows you to highlight key events including:
-

Analyze
Acumen™ Analytics Software analyzes retrospective hemodynamic parameter data from HemoSphere™ Advanced Monitoring platform when used with an Acumen IQ™ Cuff, Acumen IQ™ Sensor, ClearSight™ Finger Cuff, FloTrac™ Sensor, ForeSight™ Sensor, or TruWave™ Disposable Pressure Transducer.
Please note that not all sensors may be used with all monitoring platforms.
-

Transfer
Monitoring sessions can be downloaded from the HemoSphere™ Advanced Monitoring platform onto the Acumen™ Analytics Software onto your desktop or laptop computer. The report includes demographics data that you can organize and analyze. Patient identifiers are omitted from the data.
-

Review
The Acumen™ Analytics Software primary screen allows you to retrospectively analyze data within and between cohorts or on individual patients.
Key features of Acumen™ Analytics Software
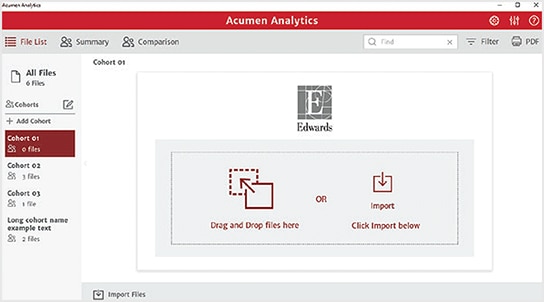
Customizable viewing pane
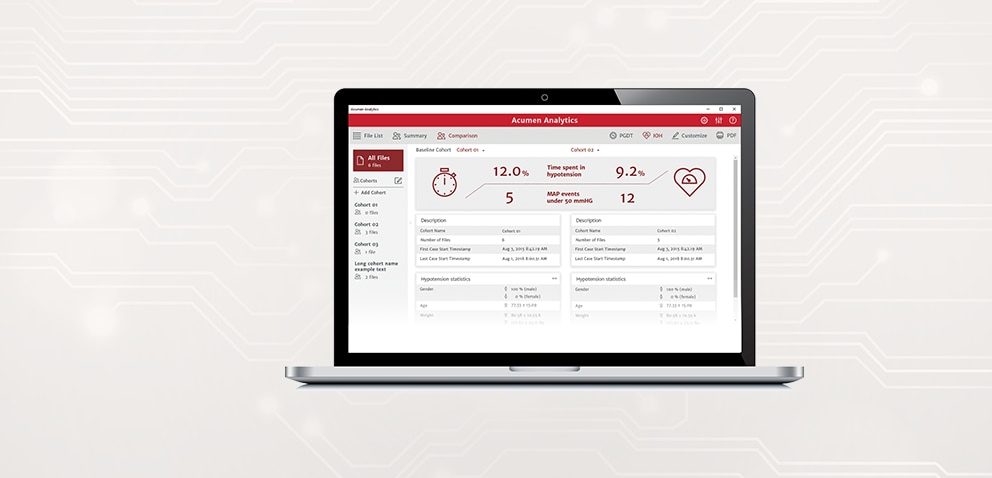
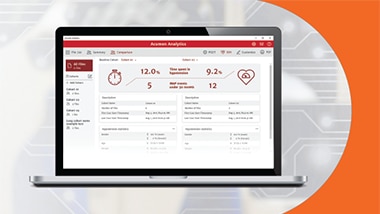
With a streamlined and customizable tile layout, the main viewing page organizes a list of all cases, cohort summaries, and cohort comparison for convenient overviews.
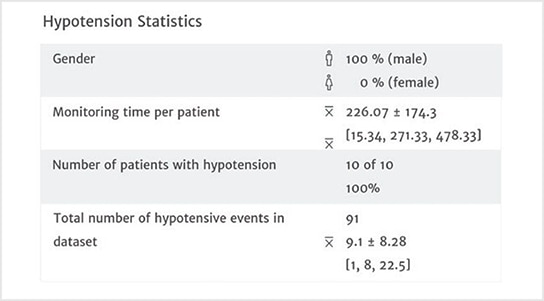
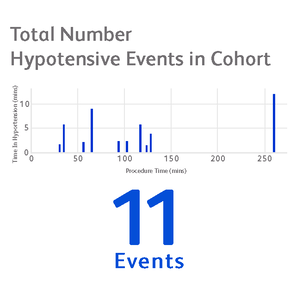
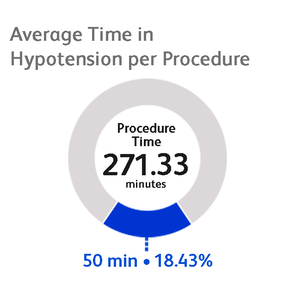
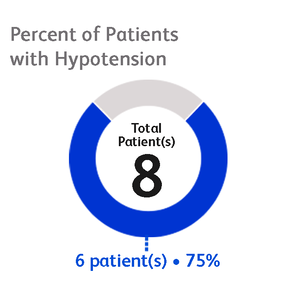
Hypotension statistics
This case summary list provides statistics on key hypotensive calculations such as average number of hypotensive events*, duration of each event, number of patients in a cohort that experienced hypotension.
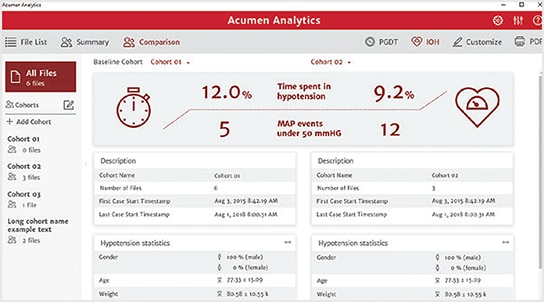
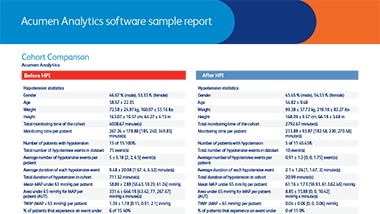
Cohort comparison
The cohort comparison screen allows you to retrospectively compare data from two cohorts. Hypotension data includes duration of hypotension and mean arterial pressure (MAP) being under 65 mmHg. The customizable cohort summary screen displays a summary of the data collected for the chosen patient or patient group.
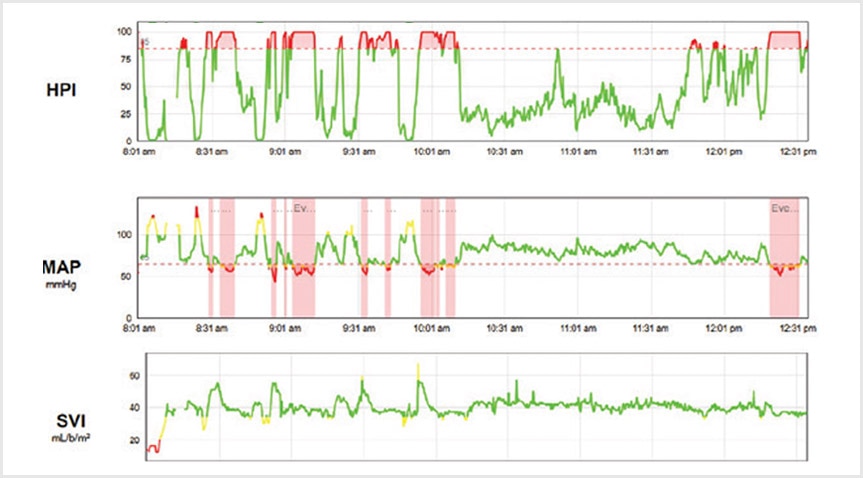
Trend parameters
At the core of Acumen™ Analytics Software is advanced hemodynamic parameter data. You can review recorded data on a number of valuable pressure and flow parameters, as well as tissue oxygen saturation from HemoSphere™ Monitoring Platform. See chart below for available parameters.
Parameter** | Description |
Hypotension Prediction Index (HPI) | Indicates the likelihood of a patient trending towards a hypotensive event* |
Dynamic arterial elastance (Eadyn) | Ratio of pulse pressure variation (PPV) to stroke volume variation (SVV). It's an estimate of arterial elastance. |
Systolic slope (dP/dt) | Maximum upslope of the arterial pressure waveform from a peripheral artery. It is the maximum rate of the arterial pressure rise during left ventricular contraction |
Cardiac output (CO) | Volume of blood pumped by the heart measured in liters per minute |
Cardiac index (CI) | Cardiac output relative to body surface area (BSA) |
Systolic pressure (SYS) | Systolic blood pressure |
Diastolic pressure (DIA) | Diastolic blood pressure |
Mean arterial pressure (MAP) | Averaged systemic blood pressure over one cardiac cycle |
Pulse rate (PR) | Number of ventricular contractions per minute |
Stroke volume (SV) | Volume of blood pumped with each heart beat |
Stroke volume index (SVI) | Stroke volume relative to body surface area (BSA) |
Systemic vascular resistance (SVR) | The resistance that the left ventricle must overcome to eject stroke volume with each beat |
Systemic vascular resistance index (SVRI) | SVR relative to body surface area |
Stroke volume variation (SVV) | The percent difference between SVmin, max and mean |
Central venous oximetry (ScvO2) | Venous oxygen saturation as measured in the superior vena cava |
Mixed venous oximetry (SvO2) | Venous oxygen saturation as measured in the pulmonary artery |
Tissue oxygen saturation (StO2) | A noninvasive continuous assessment of the balance between oxygen delivery and consumption through either cerebral or somatic tissue oximetry |
*A hypotensive event is defined as MAP <65 mmHg for a duration of at least one minute.
**Not all parameters are available with all sensors or all monitoring platforms
Minimum 32GB hard drive (minimum) with 3GB available disk space
Memory: 8GB RAM minimum
Compatible with Windows 7, 8 and 10 (32 & 64 bit)
Supports excel files that contain data points in 20-second time intervals
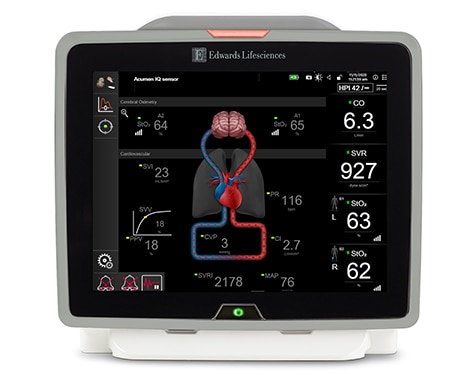
HemoSphere™ Advanced Monitoring Platform
The only modular Hemodynamic Monitoring Platform to offer full-range cuff, sensor and catheter compatibility and first-of-its-kind predictive decision support software, HemoSphere™ Advanced Monitoring platform enables proactive, individualized patient management.
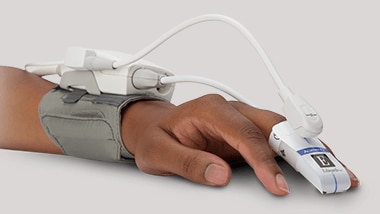
Acumen IQ™ Sensor
Access our extensive collection of informative product and educational resources, designed to keep you informed and help you achieve excellence.
BD Advanced Patient Monitoring is here to help you stay on top of the latest clinical challenges and make the most of hemodynamic monitoring solutions.
CAUTION: Federal (United States) law restricts this device to sale by or on the order of a physician.
See instructions for use for full prescribing information, including indications, contraindications, warnings, precautions and adverse events.